Temperature
This section describes changes in Aotearoa New Zealand's temperatures over time, and who might be most at risk of health impacts from temperature extremes.
On this page:
New Zealand’s climate is warming
Over the period 1909-2018 (Figure 1), the mean annual temperature in New Zealand rose at a rate of almost 1°C per 100 years. Climate scientists predict that relative to 1986-2005, New Zealand will continue to warm by 0.7°C to 1.0°C by the year 2040, and between 0.7°C and 3.0°C by 2090. Northern and eastern New Zealand will have the strongest warming trend.
Figure 1: Mean annual temperature anomaly in New Zealand, 1909-2021
Hot days are more common in northern and eastern New Zealand
There will very likely be an increase in the number of hot days (maximum temperatures above 25°C), particularly in the north of the North Island. At the same time, there will very likely be a decrease in the number of cold days (minimum temperatures below 0°C), particularly in the South Island.
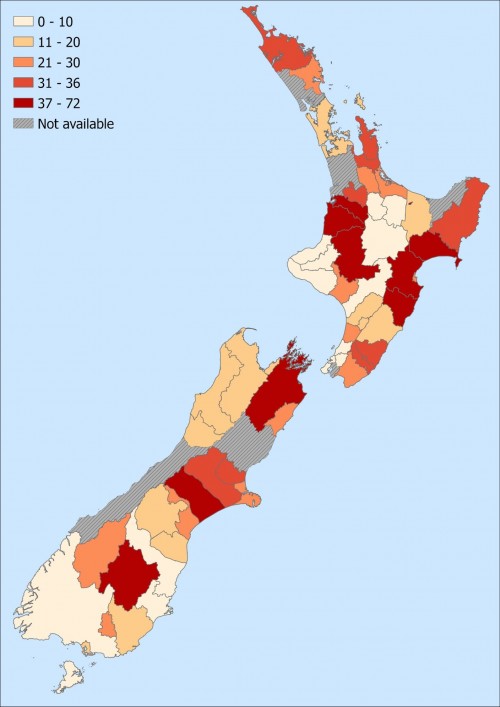
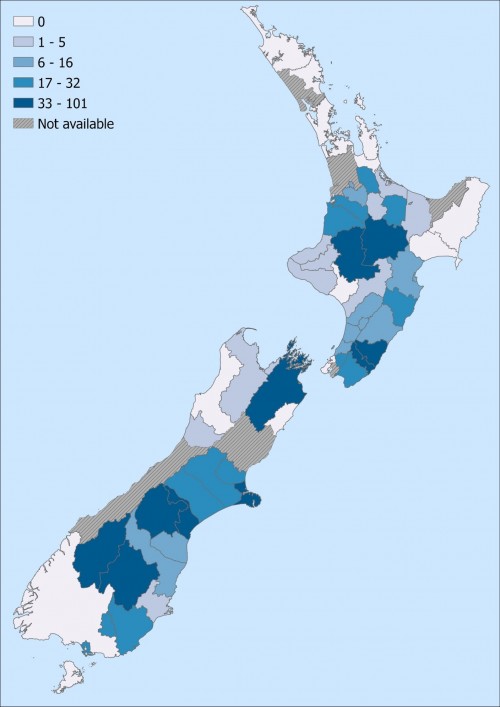
Data from 2023 show hot days were more common in the north and east of both islands. Regions particularly affected by warm temperatures were the Bay of Plenty and Waikato regions (Figure 2). Cold days were most frequent in parts of the South Island, particularly Otago and Canterbury (Figure 3).
Figure 2: Number of days with maximum temperatures over 25°C, 2023, by Territorial Authority (TA)

Figure 3: Number of days with minimum temperatures under 0°C, 2023, by Territorial Authority (TA)

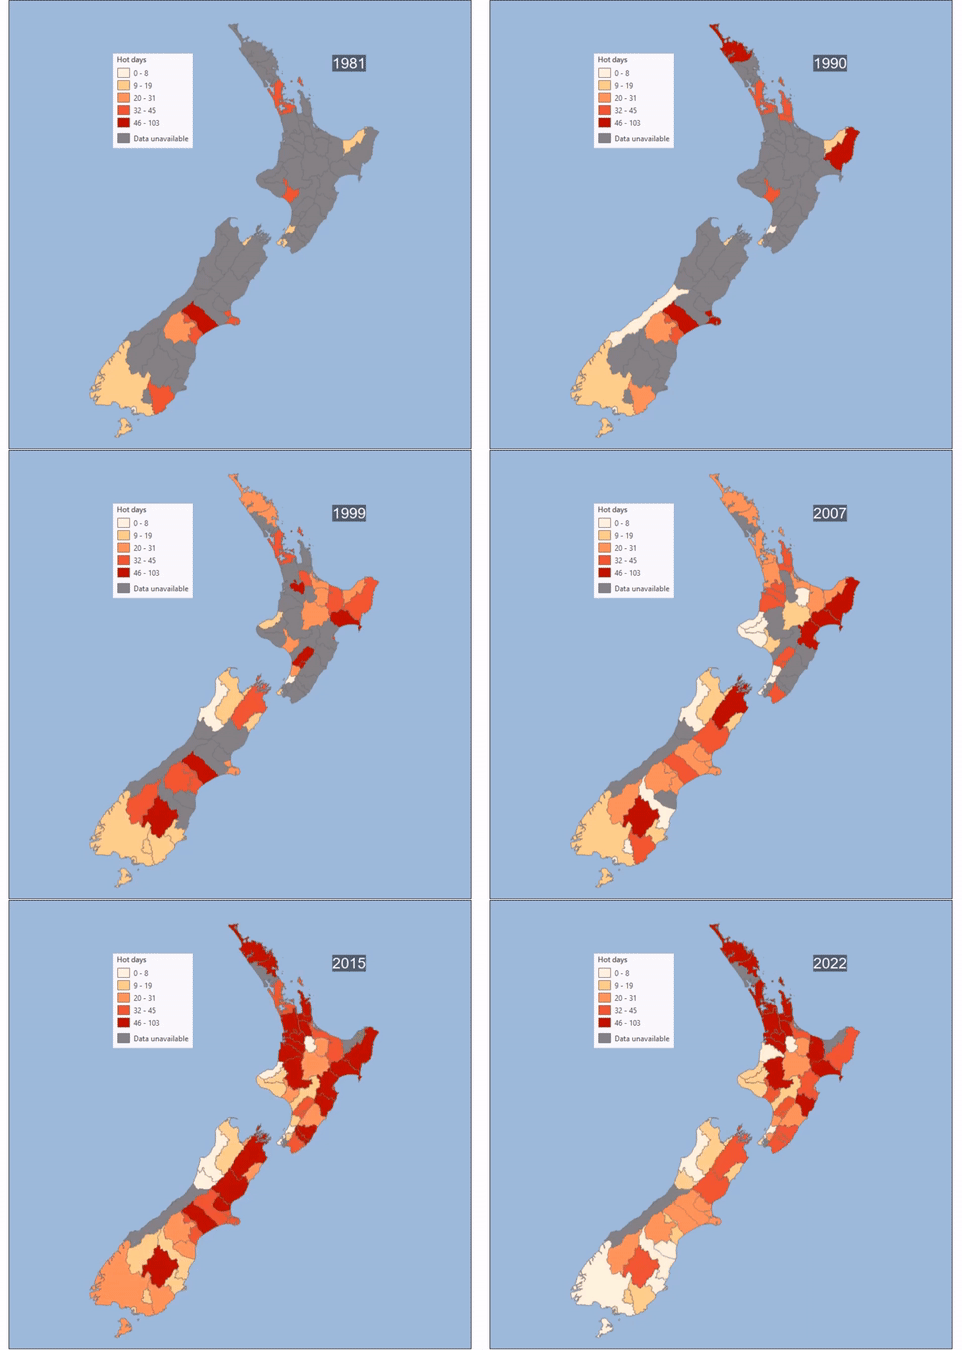
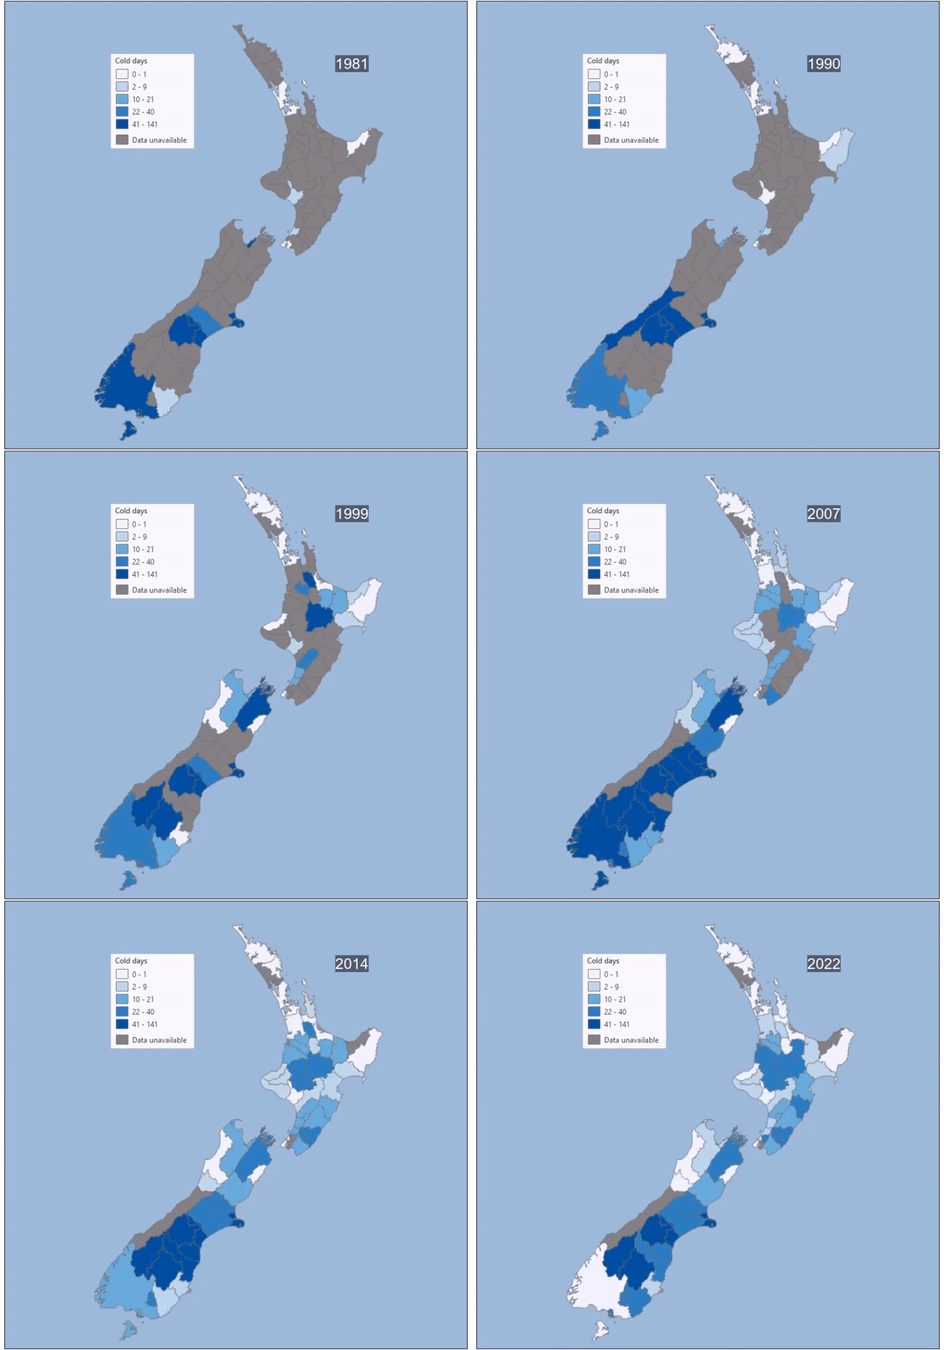
Movies 1 and 2 show how these temperature extremes have changed year-by-year between 1981 and 2022 across territorial authorities (TAs) in New Zealand.
Movie 1: Number of days over 25°C, 1981-2022, by Territorial Authority (TA)

Movie 2: Number of days below 0°C, 1981-2022, by Territorial Authority (TA)

Information about the data
Number of hot days and number of cold days
Source: CliFlo. NIWA's National Climate Database
Definition: Climate station data of the daily maximum and minimum temperatures from around New Zealand was sourced from the National Climate Database (CliFlo, a web services provided by the National Institute of Water and Atmospheric Research (NIWA). One climate station was selected per territorial authority, based on their proximity to the population-weighted centroid of each TA (2018 Census data). The number of hot days (days with a maximum air temperature above 25°C) and the number of cold days (days with a minimum temperature below 0°) was counted for each year by TA. Only years with more than 90% of valid data were counted. Data was compared to the most recent Climate Normal Period, 1991-2020, where the 30-year average acts as a benchmark against which more recent observations can be compared to.
