Environmental Health Indicators
Transport
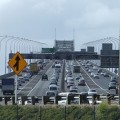
Tū wakaThis section provides data and statistics on transport and health in Aotearoa New Zealand. Find out about how transport affects health, types of transport used by New Zealanders, and how a lack of transport affects people's access to healthcare.
Domain lead: Kirsty Craig
Dashboard - Transport
Open dashboard in new window