Drought and rainfall
This section describes changes in drought conditions and extreme rainfall in Aotearoa New Zealand over time, and who might be most at risk of health impacts from these extremes.
 Surveillance Reports and Metadata
Climate models predict more droughts for parts of New Zealand
The amount of rainfall in New Zealand varies around the country and with season. It is projected that climate change will cause the annual amount of rainfall and the number of days with extreme rainfall to increase in the west and south and decrease in the north and east of both islands. The number of dry days is projected to increase in the North Island and in inland South Island [1].
The frequency of extreme rainfall and dry weather varies around the country
Areas with more frequent dry periods are more likely to experience droughts, whereas areas with extreme rainfalls are more likely to experience flooding. Detecting changes in rainfall patterns in New Zealand is difficult due to the high variability in rainfall from year to year and from region to region. The variability is caused by changing weather patterns and natural climate variations such as El Niño [5].
In 2024, New Zealand experienced an average of 15.5 extreme rainfall days, though several TAs, particularly in the North and East of the North Island, experienced much more than the average (Figure 4a). Note that ʻextreme rainfallʼ refers to rain in quantities above normal levels for a given region. That is, if one region has more extreme rainfall days than another, that does not imply that the first region received more rain, only that it experienced more days of unusually high rainfall (Figure 1).
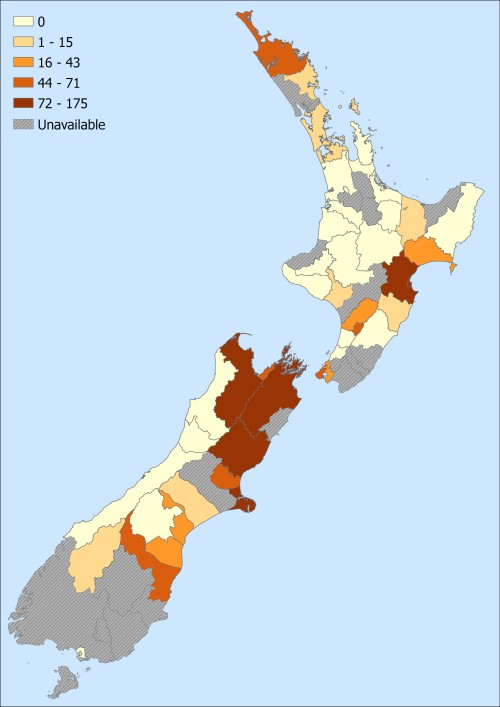
Meanwhile, New Zealand experienced an average of 42 severely dry days and 28.3 extremely dry days in 2024, with some areas having in excess of 200 days with a deficit of rainfall that year. ‘Severely dry’ days (where the soil moisture deficit was between 110–130mm) were most common around the central North Island and east coast of the South Island and ‘extremely dry’ days (where soil moisture deficit was 130mm or more) were most common around the upper and eastern South Island, and the Hawke’s Bay area (figures 2,3)
Figure 1: Number of days with extreme rainfall, 2024, by Territorial Authority (TA)
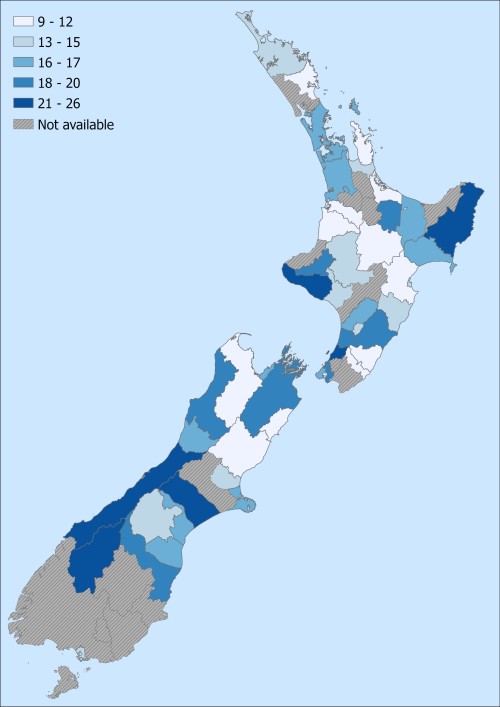
Figure 2: Number of severely dry days, 2024, by Territorial Authority (TA)
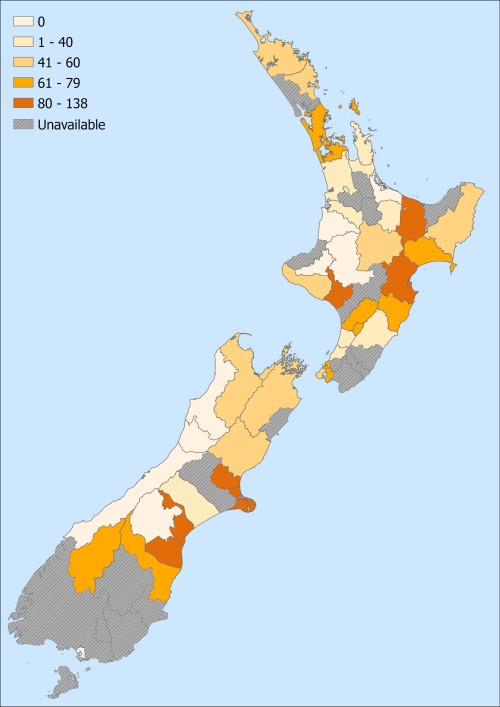
Figure 3: Number of extremely dry days, 2024, by Territorial Authority (TA)
Information about the data
Number of days with Soil Moisture Deficit
Source: DataHub. NIWA's National Climate Database
Definition: The number of days per year where soil moisture deficit exceeded the thresholds used by NIWA to indicate severe and extreme dryness was counted for each year by TA. One climate station was selected per territorial authority, based on their proximity to the population-weighted centroid of each TA (2018 Census data). The number of dry days was counted for each year by TA. Only years with more than 90% of valid data were counted. Data was compared to the most recent Climate Normal Period, 1991-2020, where the 30-year average acts as a benchmark against which more recent observations can be compared to.
Annual amount of rainfall, and number of days with extreme rainfall
DataHub. NIWA's National Climate Database
Definition: Climate station data of the amount of daily rainfall (in mm) from around New Zealand was sourced from the National Institute of Water and Atmospheric Research (NIWA). One climate station was selected per territorial authority, based on their proximity to the population-weighted centroid of each TA (2018 Census data). The amount of rainfall was calculated for each year by TA. Only years with more than 90% of valid data were counted. The 95th percentile for the period 1981-2010 was calculated for each TA and number of days above this percentile was counted as extreme rainfall days. Data was compared to the most recent Climate Normal Period, 1991-2020, where the 30-year average acts as a benchmark against which more recent observations can be compared to.
References 
- Ministry for the Environment. 2018. Climate change projections for New Zealand: Atmospheric projections based on simulations undertaken for the IPCC 5th Assessment. 2nd Edition. Wellington: Ministry for the Environment.
- McMichael AJ. 2013. Globalization, Climate Change, and Human Health. New England Journal of Medicine 368(14): 1335-1343. DOI: 10.1056/NEJMra1109341 (accessed 9 February 2021).
- Britton E, Hales S, Venugopal K, et al. 2010. Positive association between ambient temperature and salmonellosis notifications in New Zealand. Australian and New Zealand Journal of Public Health 34(2): 126-9. DOI: 10.1111/j.1753-6405.2010.00495.x (accessed 9 February 2021).
- Lal A, Baker MG, Hales S, et al. 2013. Potential effects of global environmental changes on cryptosporidiosis and giardiasis transmission. Trends in Parasitology 29(2): 89-90. DOI: 10.1016/j.pt.2012.10.005 (accessed 9 February 2021).
- Ministry for the Environment and Stats NZ. 2020. New Zealand’s Environmental Reporting Series: Our atmosphere and climate. Wellington: Ministry for the Environment and Stats NZ.